Social Performance
Social Performance shows how your posts on X and LinkedIn are doing: views, engagements and link clicks, read from the networks on demand or nightly.
Watch the video
Social Performance shows how the posts you published on X and LinkedIn from the app are doing. It’s a dashboard, drawn like the ones in Dashboards, with the figures the networks give for each post: views, likes, reposts, replies, quotes, bookmarks and link clicks.
Where you find it
Open Studio in the left menu, then Social Performance. The page covers your whole organization: every post sent on X and LinkedIn in the period you pick, from every account, whatever the brand, as long as you may open that brand.
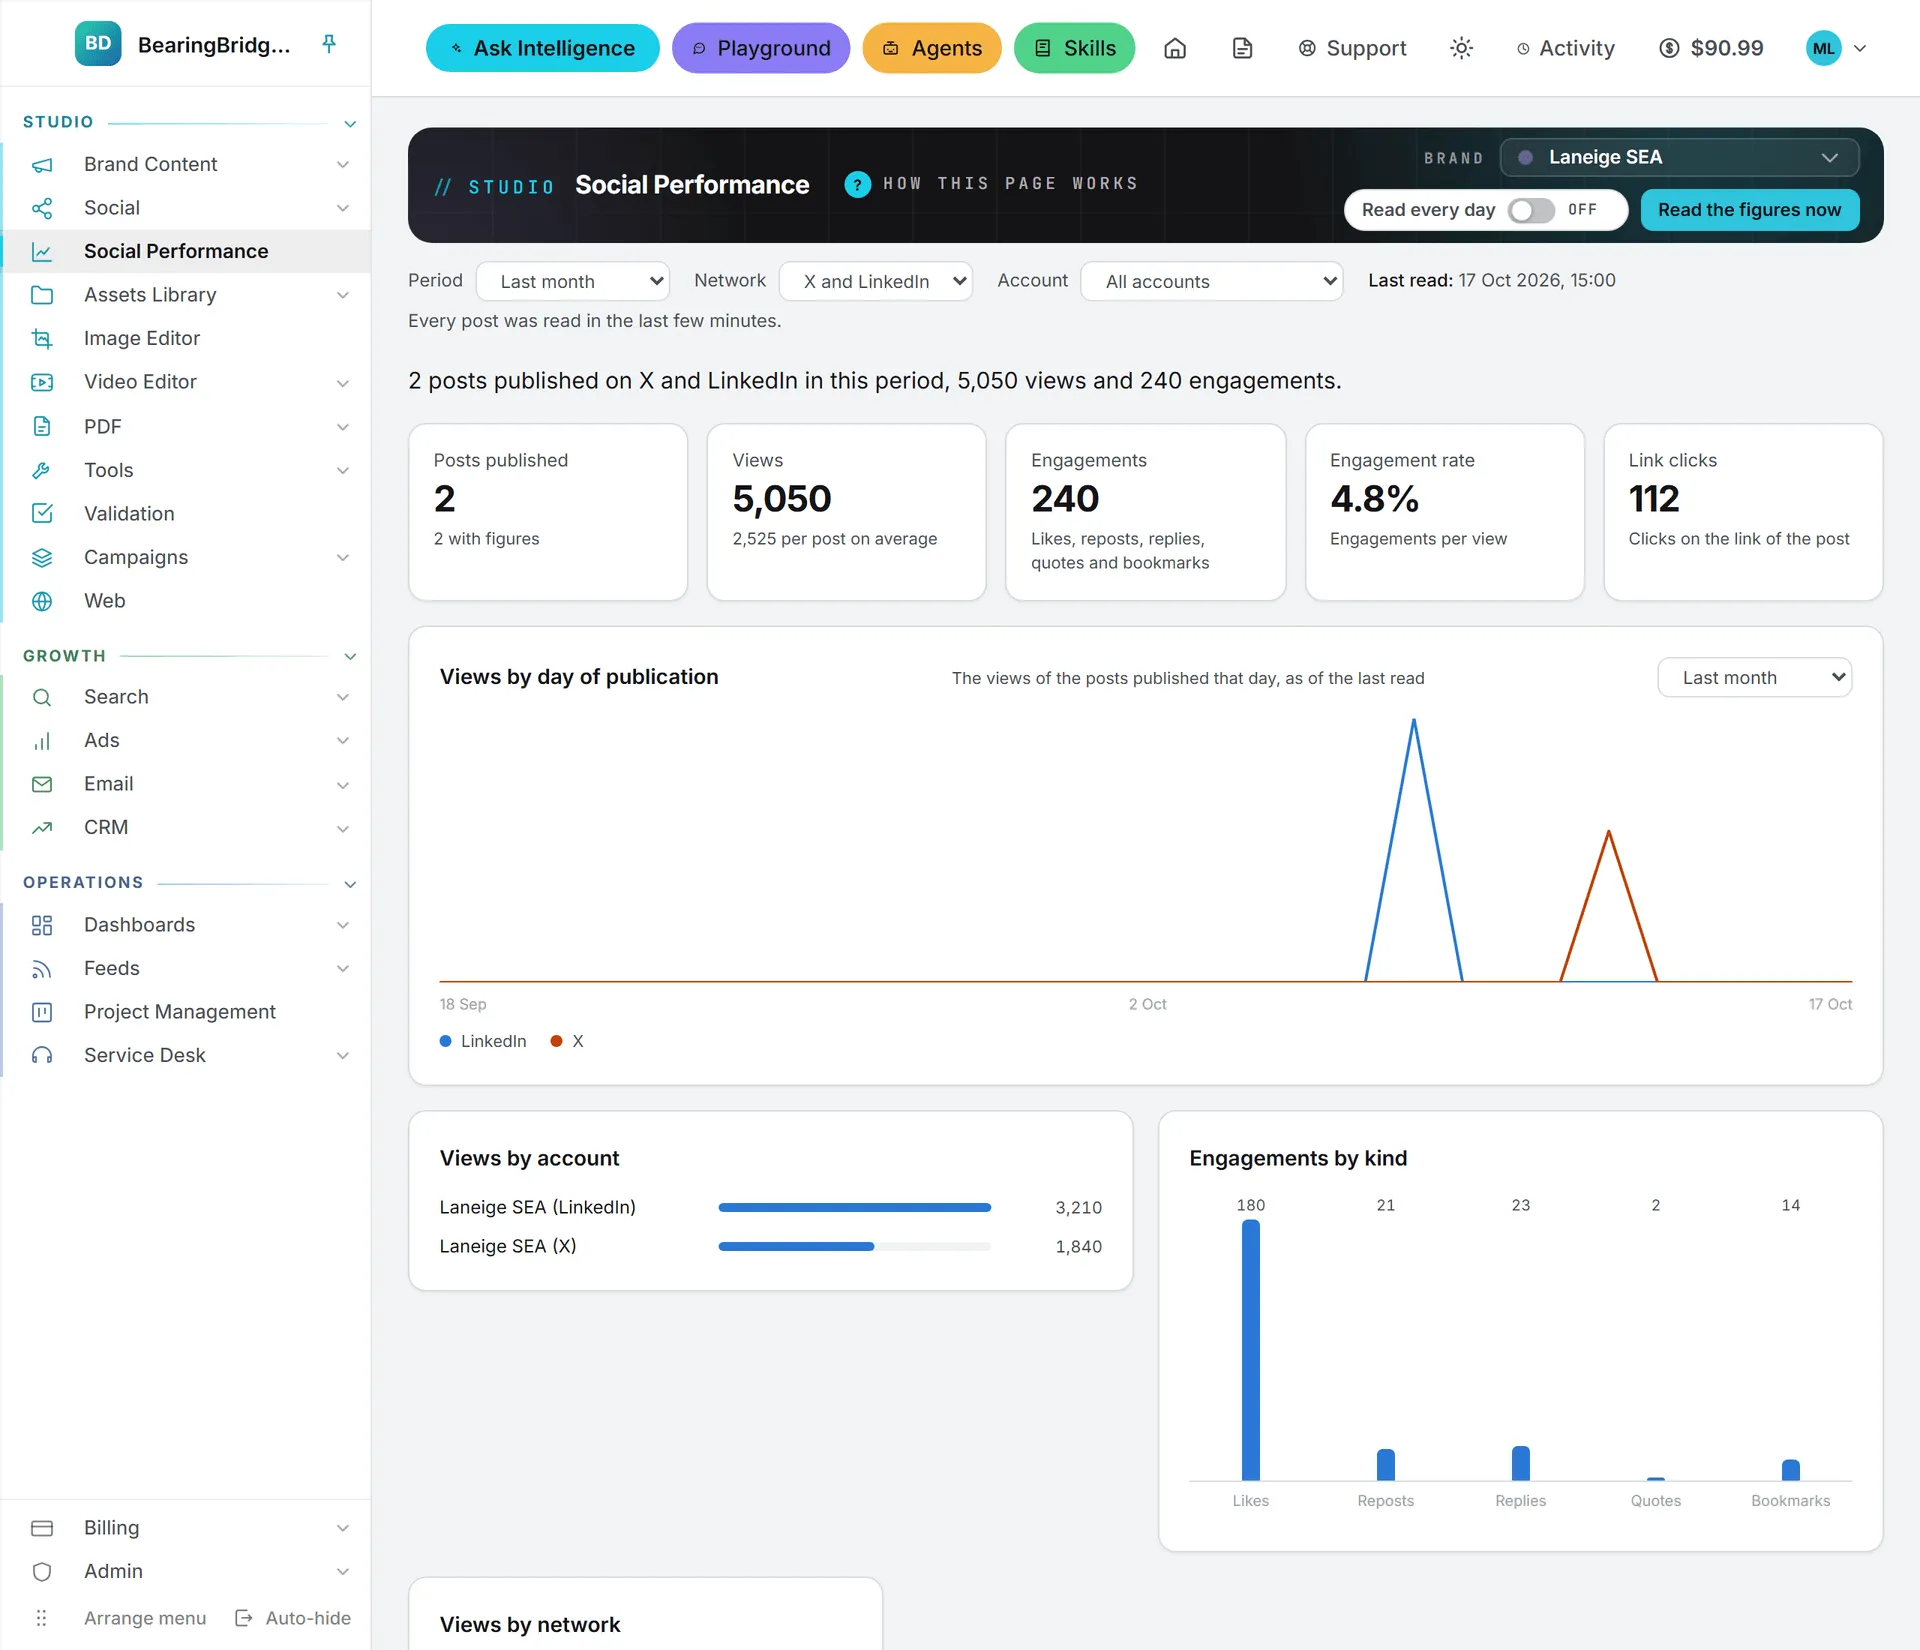
Reading the dashboard
The top of the page has three filters:
- Period: yesterday, the last 7 days, the last 2 weeks, the last month, the last 3 months, or a custom period: pick Custom period, set the two dates, then click Show.
- Network: X and LinkedIn together, or one of them.
- Account: one social account, or all of them. The list shows the accounts that published in the period on the network you picked.
Under them, one sentence sums up the period, then five figures:
| Figure | What it counts |
|---|---|
| Posts published | The posts sent in the period, and how many of them have figures |
| Views | The views the networks counted on those posts, and the average per post |
| Engagements | Likes, reposts, replies, quotes and bookmarks added up |
| Engagement rate | Engagements divided by views |
| Link clicks | The clicks on the link the post carries |
The charts show the views by day of publication, the views by account and what the engagements are made of. The views chart has its own period, picked in its header with the same choices as the filter: it follows the page until you pick one there, and Yesterday draws it hour by hour. Every post lists the posts one by one, 50 to a page, the latest first. Click a column title to sort on it, and click again to turn the order round. A post’s title opens it on the network.
Reading the figures again
Opening the page costs nothing: it shows the figures of the last read, and Last read says when that was.
- Read the figures now asks the networks again for every post of the last 30 days. The line next to the filters says how many posts the next read covers and what it costs. A post read in the last few minutes is not read again.
- Read every day asks the networks once a day, in the evening, after the day’s posts went out. Switch it on once and the figures stay current. The daily read is billed to the person who switched it on.
What a read costs
X bills every post it’s asked about, so a read of X posts is billed in credits, like a post sent to X. The price of the next read is written on the page before you press the button. Reading LinkedIn is free.
LinkedIn figures
LinkedIn gives figures for the posts of a company page only. The posts of a personal profile are listed, marked as having no figures, and left out of the totals. A post the network refused to read shows the reason under its title.
Good to know
- A repost isn’t counted twice: its figures are those of the original post.
- The figures are read for the posts of the last 30 days. An older post keeps the figures of its last read, so a period of 3 months shows the posts of the first two months as they stood then.
- The figures are the networks’ own, as of the last read. A post keeps gathering views for a few days, so a recent post grows from one read to the next.
- The publishing side (what was planned, what went out, what failed) is on Social reporting.
Who can see it
Anyone whose role has the Social Performance row in roles and rights can open the page. Reading the figures needs the Create right, and switching the daily read needs the Update right.