Dashboards
A tile-by-tile guide to the Visibility, Watchers, Content, Commercial and Delivery dashboards: what each number counts, which module feeds it, and who can see it.
Business Intelligence holds five standard dashboards: Visibility, Watchers, Content, Commercial and Delivery. (The ones you describe in your own words are covered in Build your own dashboard.) Below, each one is taken apart tile by tile, with where its numbers come from and who gets to see them. You open them from the Business Intelligence sub-menu in the left menu; the overview explains the menu itself. Feeds, which used to sit in this menu, is now a module of its own.
How every dashboard works
Dashboards only read data. Each time you open one, it works out its numbers from records the app already keeps. It never runs a rank check, an AI search run or an agent by itself. Those run in their own modules (Search, Agents), at the price shown there, and the dashboard picks up the results the next time you open it. The dashboard costs nothing to open. See credits and costs.
- Hover a bar or a point to see its exact value.
- An empty chart tells you which module fills it.
- Each dashboard has a link at the top right to the module it reads: Open Search, Open Agents, Open Content, Open CRM or Open the board.
- Days, weeks and months are counted in your own time zone. Weeks start on Monday.
No need to read on from top to bottom: jump to the dashboard you have open.
| Dashboard | Reads | Scope | Also needs |
|---|---|---|---|
| Visibility | Search and AI search results | The active brand | Search |
| Watchers | Agent findings | Every brand you can see | No other capability |
| Content | Content plans, outlines, articles | The active brand | Brand Content |
| Commercial | CRM deals, revenue lines | The whole organization | Sales |
| Delivery | Tasks and projects | The tasks you can see | Project Management |
Visibility
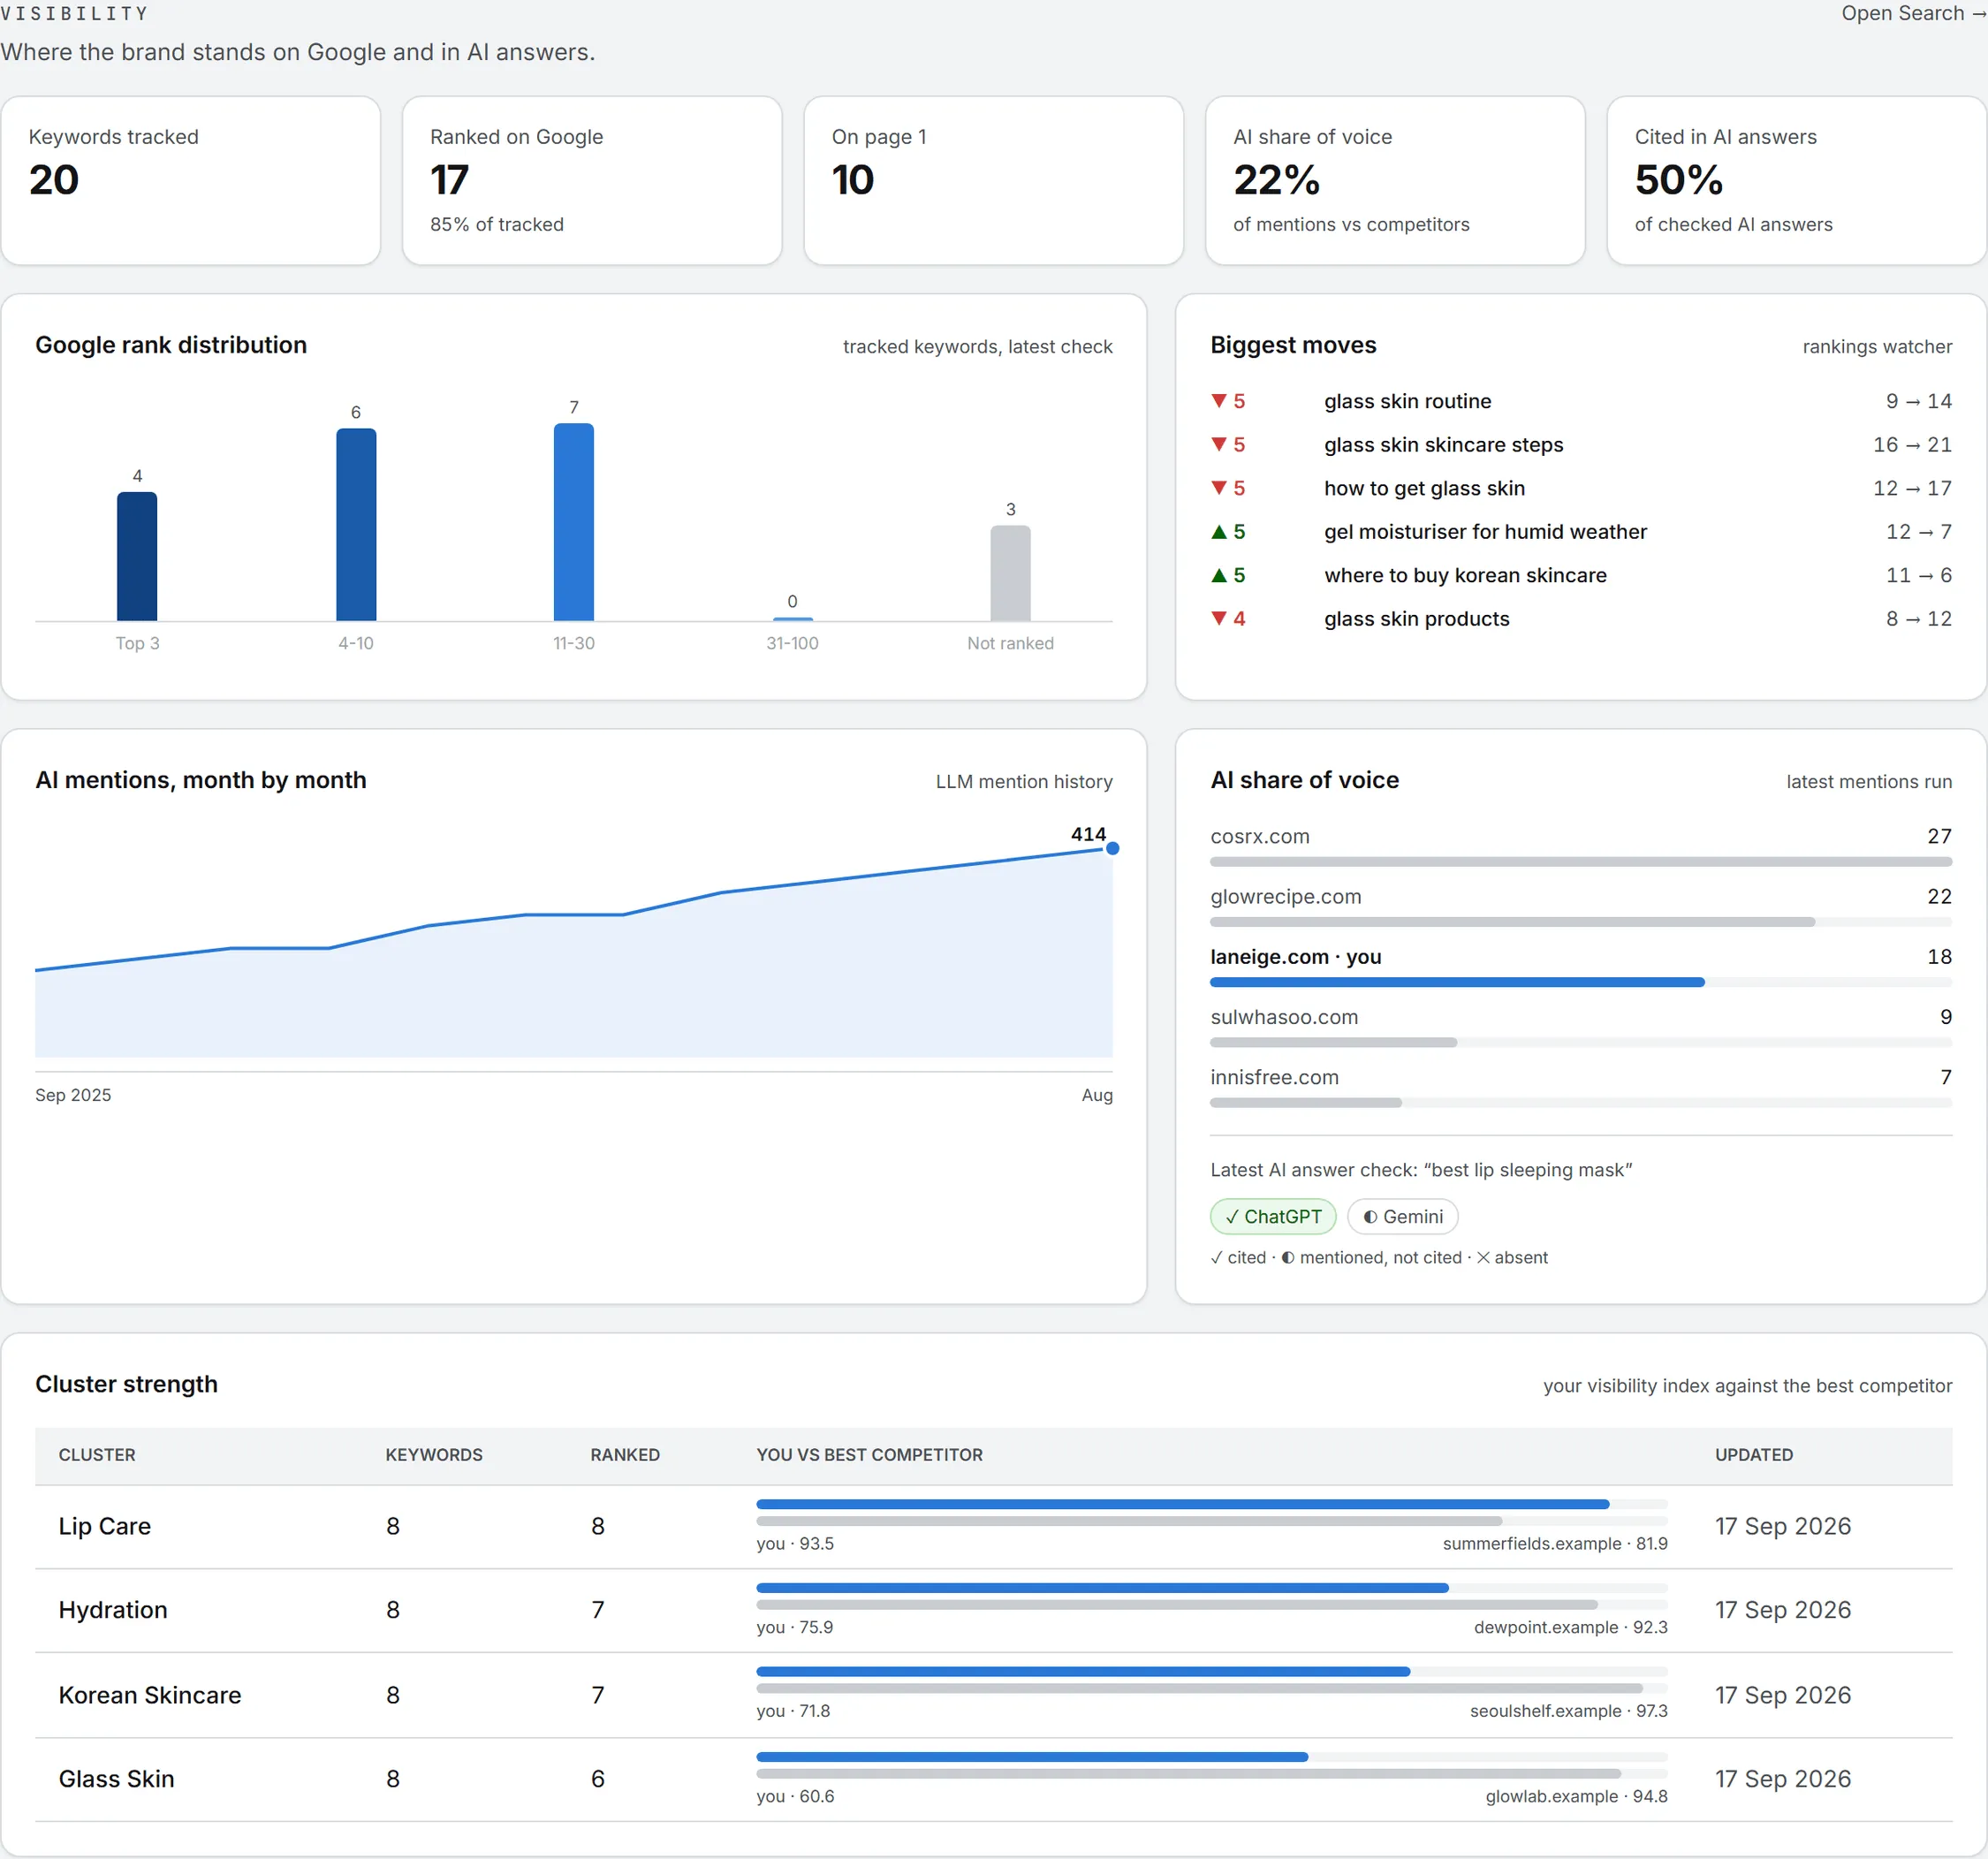
Visibility shows where the active brand stands on Google and in AI answers. It follows the brand picker in the header, and leaves the menu while the active brand has Search switched off. Everything here comes from Search: the keywords you track, the latest rank stored for each, your SERP reports and your GEO runs.
The five tiles
Keywords tracked counts the keywords the brand tracks, and Ranked on Google how many of them hold a Google position at their latest check, with the share that represents. On page 1 narrows that to positions 1 to 10.
The last two cover AI. AI share of voice is the brand’s share of all mentions, against its competitors, in the latest AI mentions run. Cited in AI answers is the share of checked AI answers that cite the brand, across every check stored. Both read “n/a” until a run exists.
The charts
Google rank distribution sorts the tracked keywords by their latest rank: Top 3, 4-10, 11-30, 31-100 and Not ranked. Add keywords in Keywords and it fills in.
Biggest moves lists up to six keywords whose rank changed the most, with the old and the new position. The rankings watcher fills this list as positions change (see Agents). An up arrow means the keyword climbed.
AI mentions, month by month draws one line across the last 12 months of AI mention history. It fills once you run Trends on the GEO page (AI search and GEO).
AI share of voice ranks up to eight domains by mentions in the latest mentions run, with your brand marked “you”. Under it, the latest AI answer check lists each AI platform with a mark: a check when the brand is cited, a half circle when it’s mentioned but not cited, a cross when it’s absent.
Cluster strength is a table of up to ten keyword clusters from your SERP reports. For each: the number of keywords, how many rank, your visibility index against the best competitor’s (two bars, yours on top) and the date of the report. Refreshing a cluster in Search fills it.
Watchers
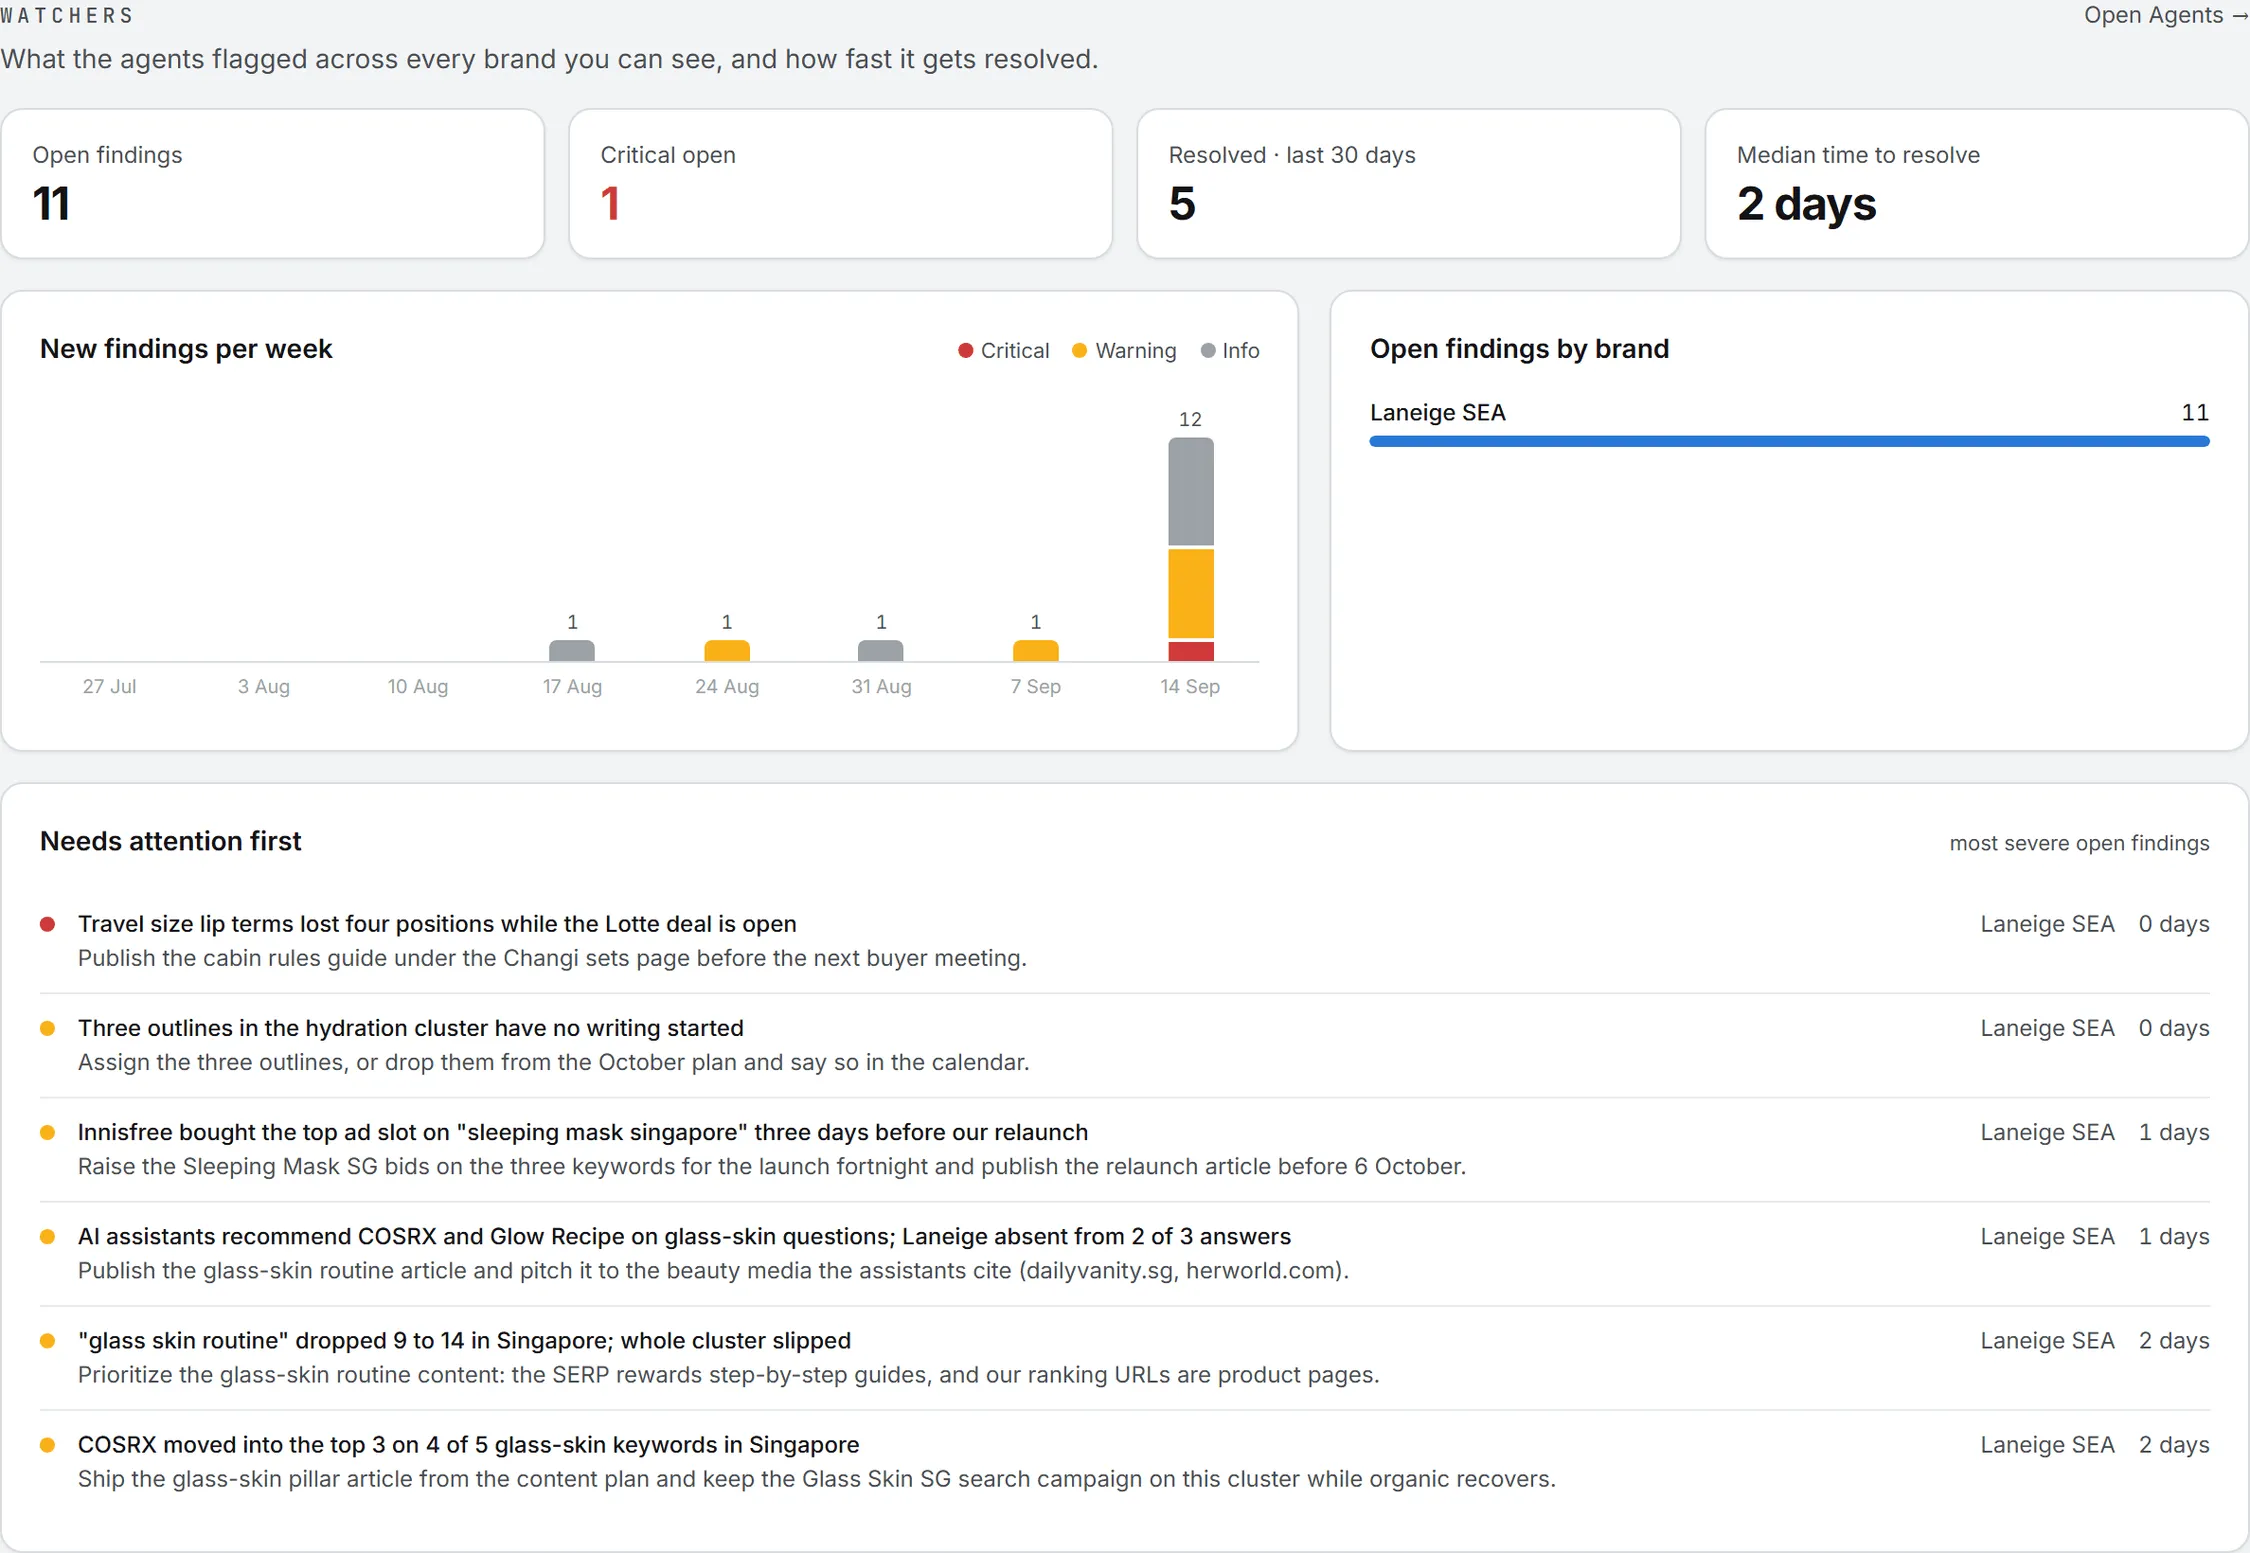
Watchers shows what the agents flagged across every brand you can see, and how quickly those findings get fixed. A finding counts as open while it’s new or acknowledged. Resolved and dismissed findings are closed. The numbers are drawn from each brand’s 200 most recent findings.
What the tiles count
Open findings counts every open finding, and Critical open the ones of critical severity; that tile turns red as soon as there’s one. Resolved · last 30 days counts the findings resolved in the past 30 days. Median time to resolve looks only at resolved findings and gives the median number of days between a finding appearing and being resolved.
The charts
New findings per week stacks the findings of each of the last eight weeks by severity: critical, warning and info. It fills once you activate watchers on the Agents page (Organization agents).
Open findings by brand ranks your brands by open findings.
Needs attention first lists the six most severe open findings, newest first within a severity, each with its suggested action, its brand and its age in days.
Content
Content follows the active brand’s pieces from plan to published, and how often you publish. It follows the brand picker (and leaves the menu while the active brand has Brand Content off) and reads Content plan and Articles.
The four tiles
Content plans and Outlines count what exists. Published total counts every published piece, and Published · last 30 days those published in the past 30 days. A published outline whose written article is also published counts once.
The charts
Pipeline funnel follows six steps: Content plans, Outlines, Outlines validated, Drafts written, Approved (drafts past the draft stage) and Published. Your first content plan starts it.
Published per month counts the pieces published in each of the last six months.
Commercial
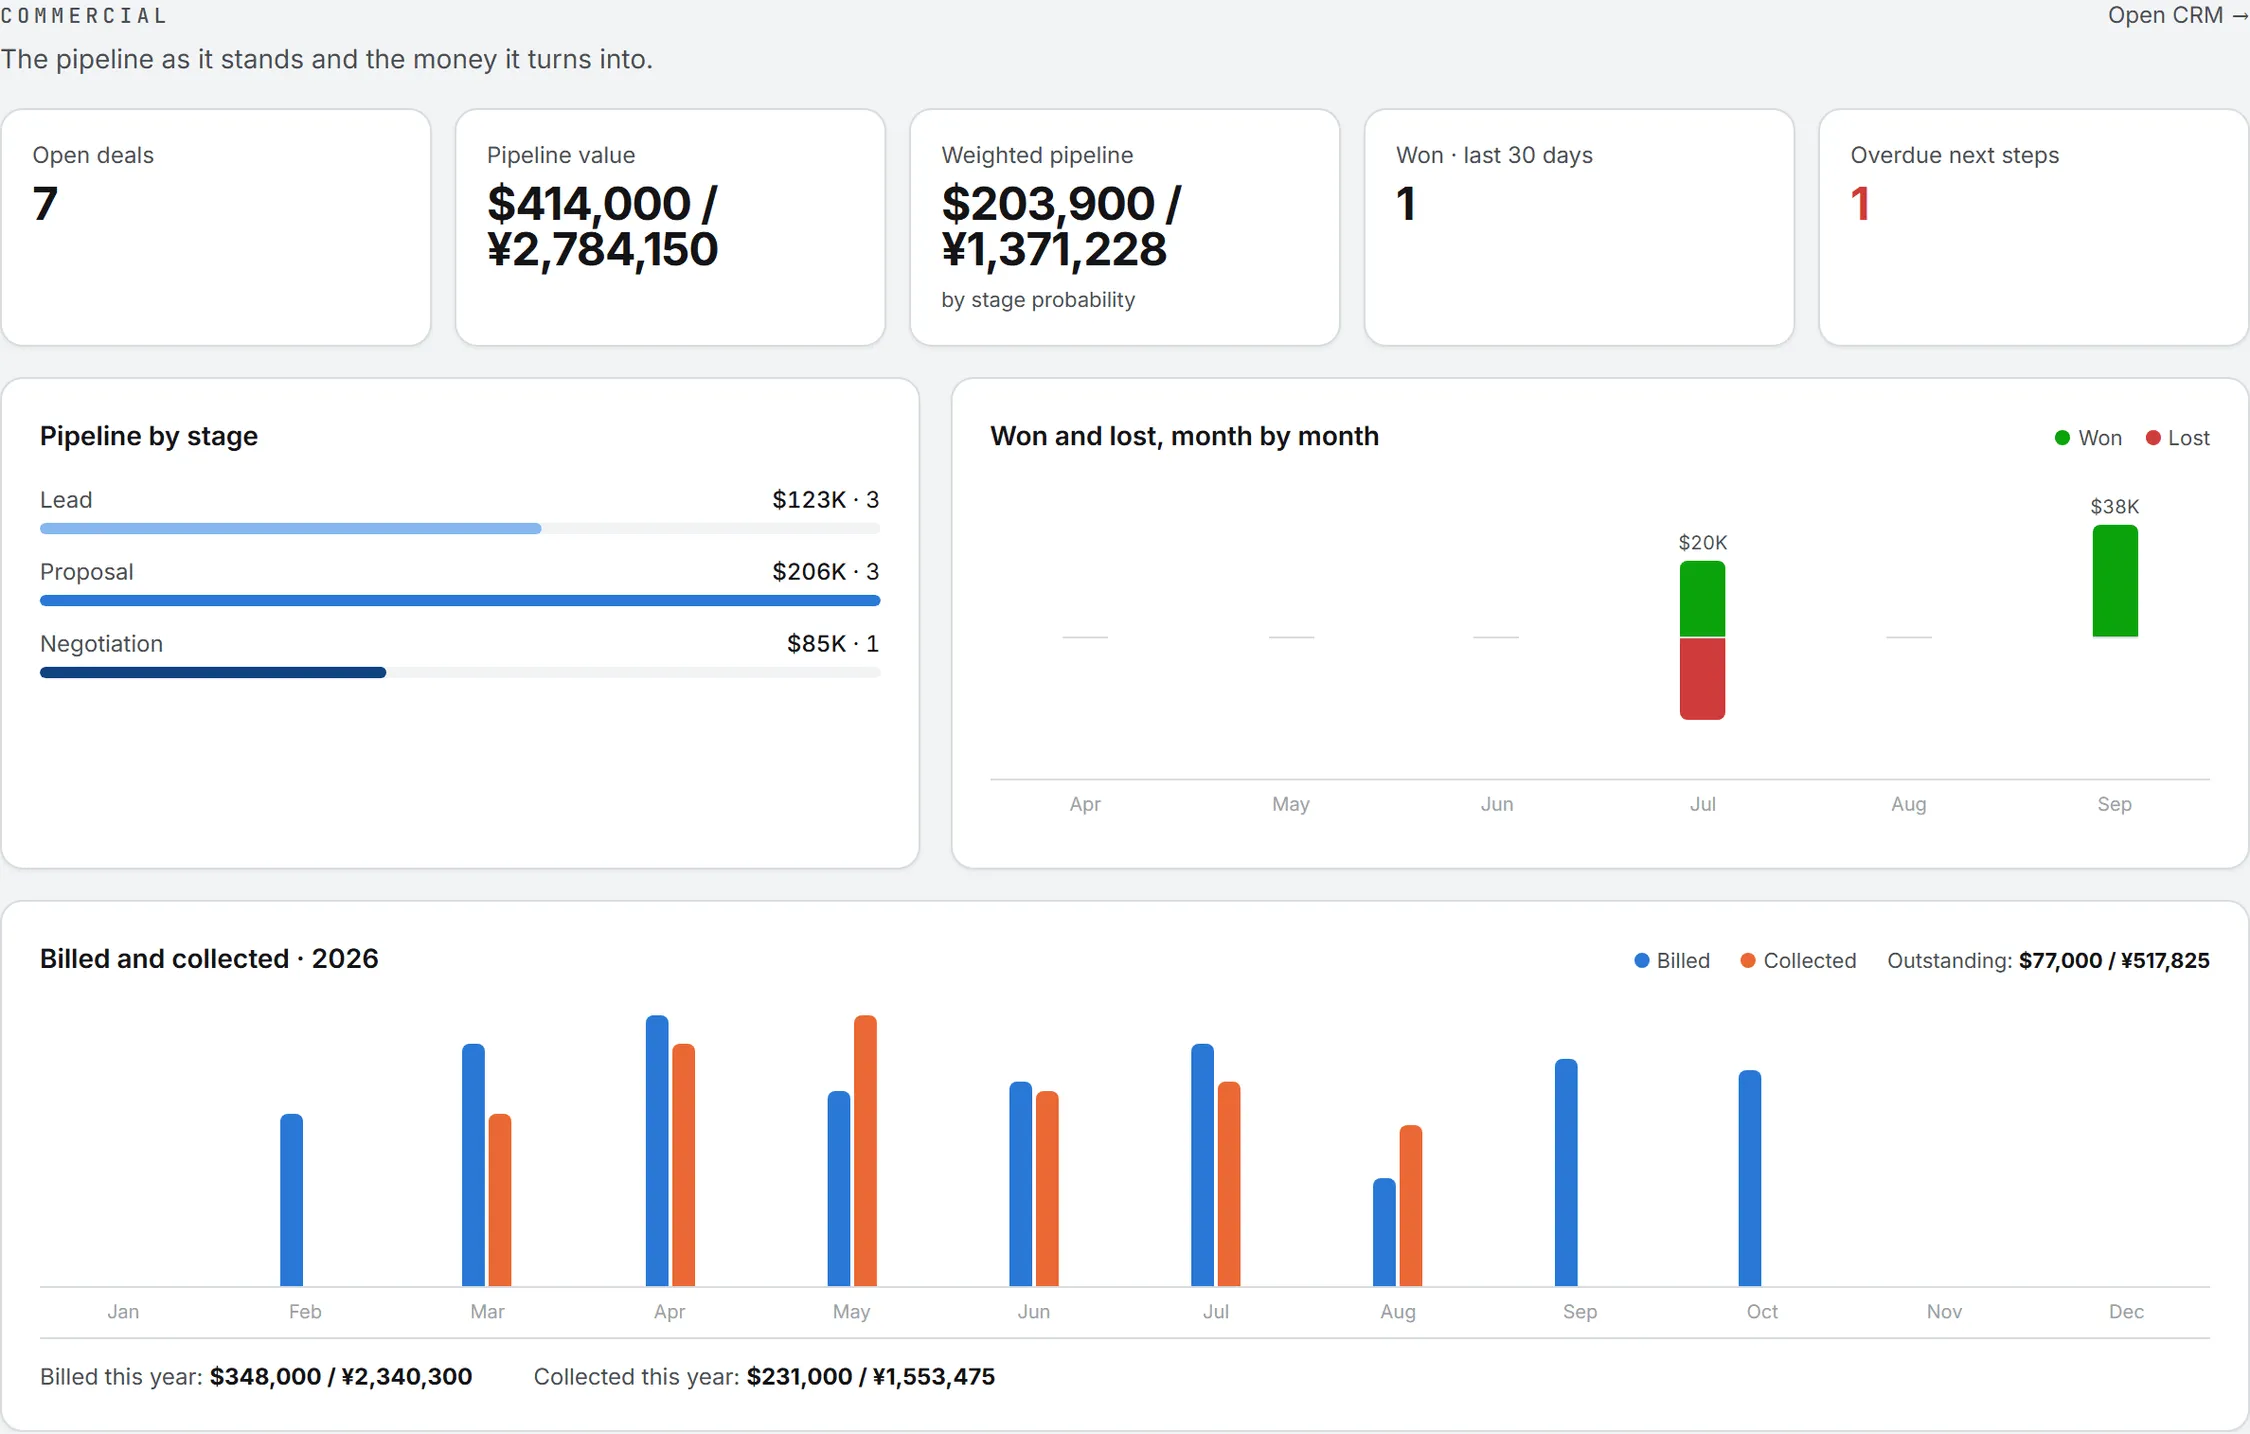
Commercial covers the money side: the deals open today, and what closed deals brought in. It reads the CRM across the whole organization, with every amount in the organization’s reference currency.
The five tiles
Open deals counts the deals in Lead, Proposal or Negotiation, and Pipeline value adds up what they’re worth. Weighted pipeline counts each of them at its stage’s weight, set under Stage weights in CRM settings.
Won · last 30 days counts the deals won in the past 30 days. Overdue next steps counts the open deals whose next step date, set on the deal, has passed, and turns red when there’s at least one.
The charts
Pipeline by stage shows the value and the number of deals in Lead, Proposal and Negotiation.
Won and lost, month by month puts the value won above the line and the value lost below it, for the last six months.
Billed and collected shows, month by month for this year, what was billed and what was collected, with the amount outstanding and the year’s totals billed and collected. It reads Revenue Follow Up.
Note: Billed and collected only appears for people whose role may view revenue. Everyone else sees the deal charts alone.
Delivery
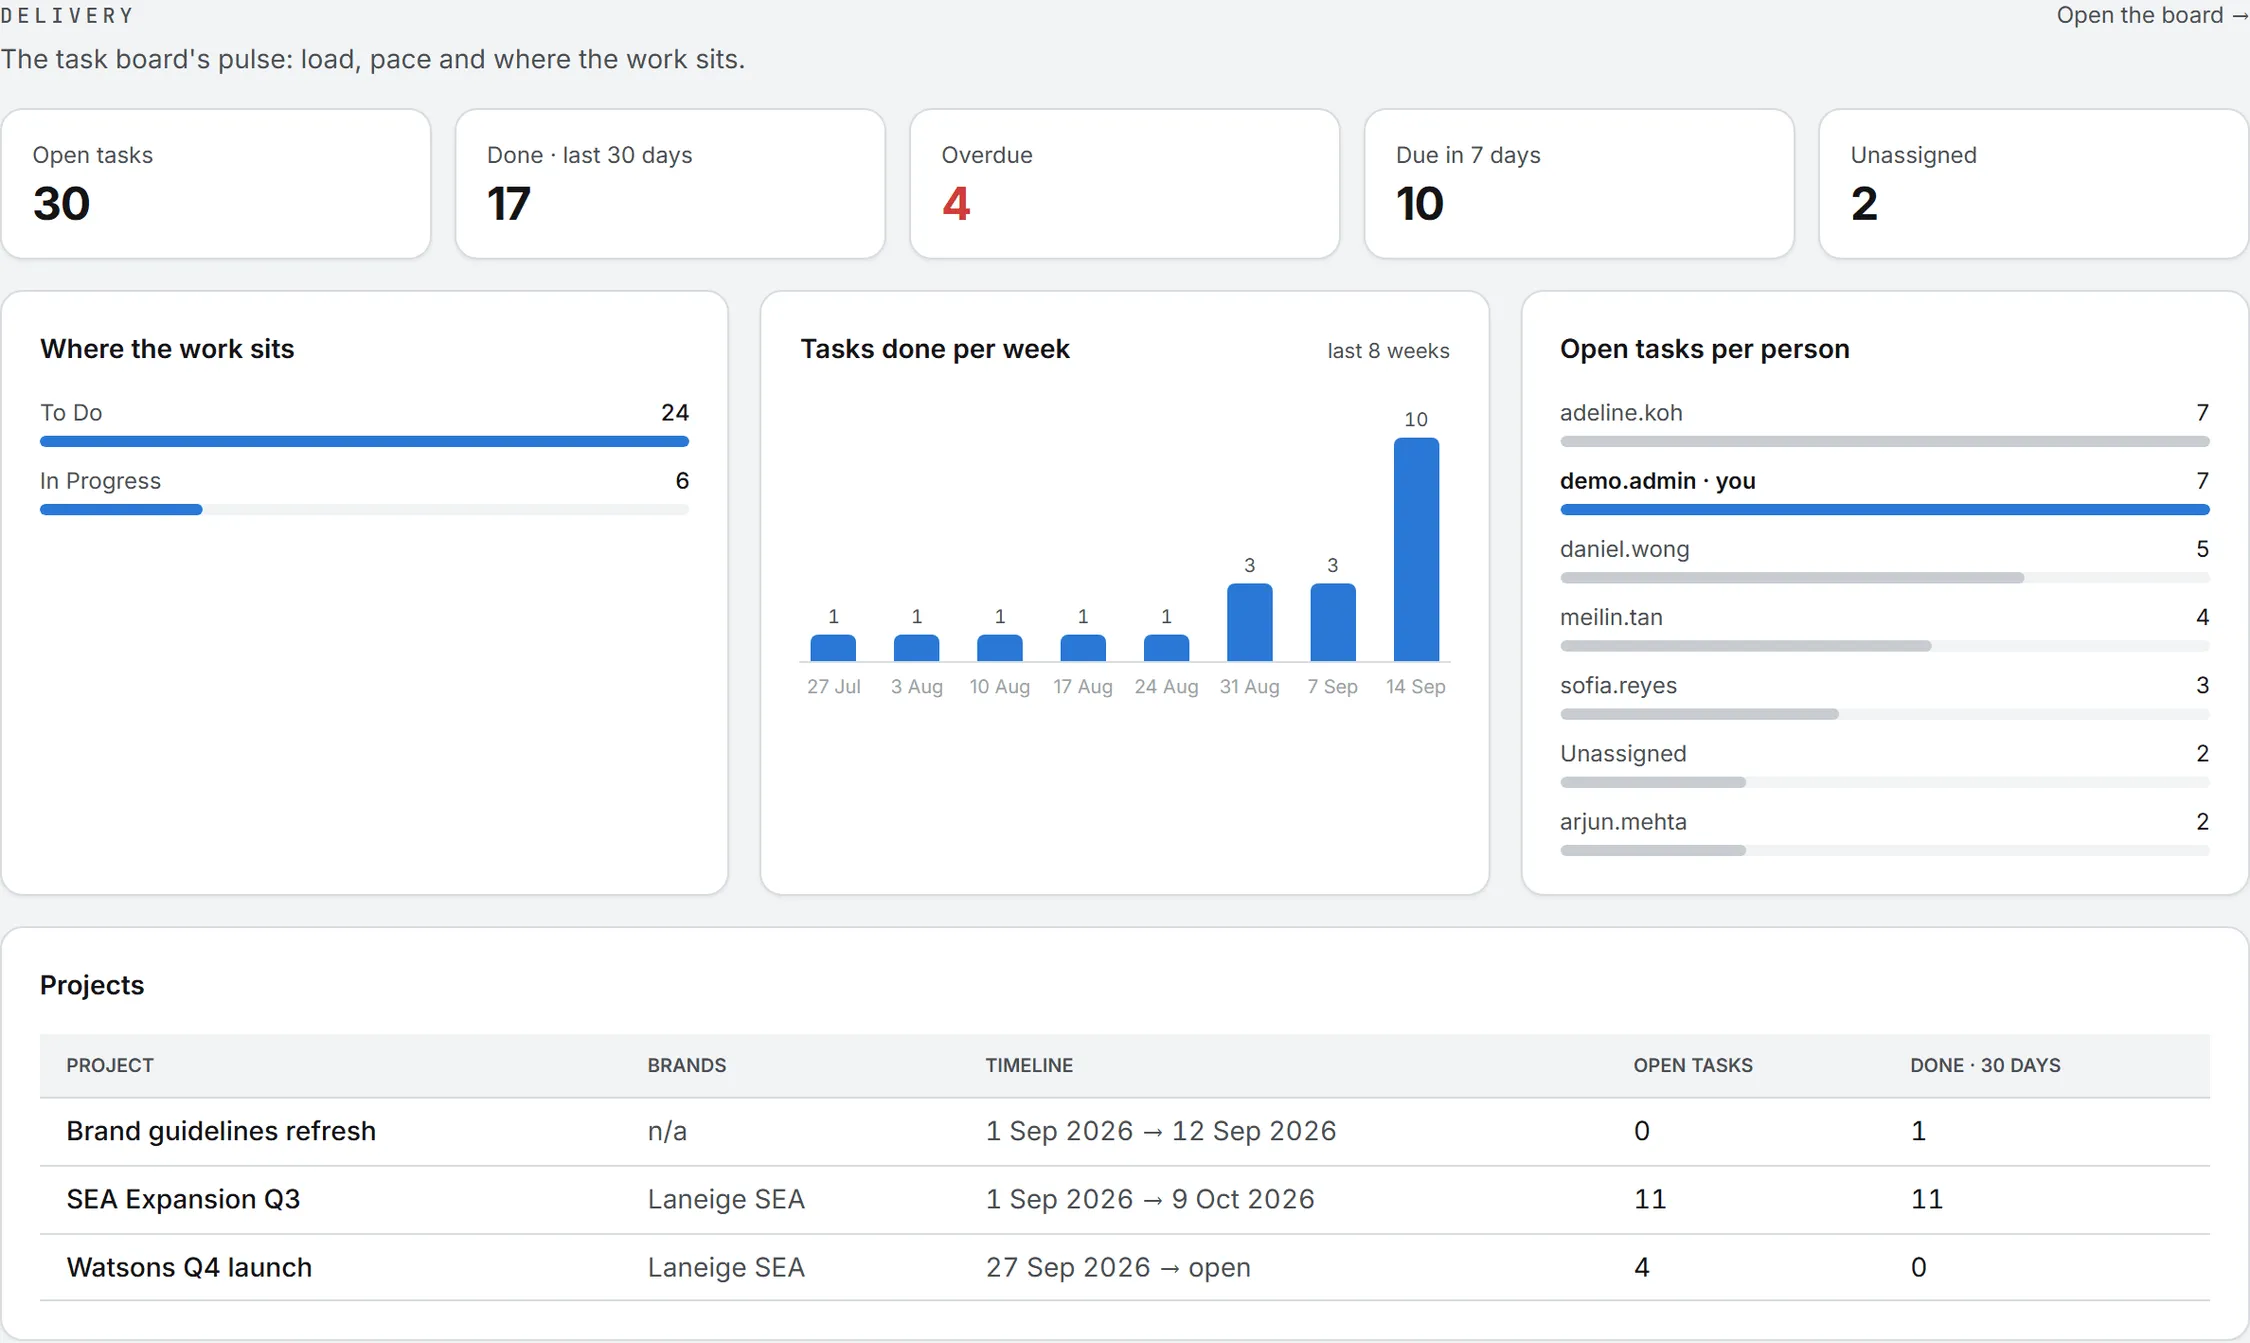
Delivery takes the pulse of the task board: how much work is open, and where it’s piling up. It counts only the tasks you can see. Admins see every project. Everyone else sees the projects they’re on, plus the personal tasks they created or were assigned.
The task counts
Open tasks counts every task not done, and Done · last 30 days the ones finished in the past 30 days. Overdue counts open tasks past their end date and turns red when there’s at least one. Due in 7 days looks ahead a week. Unassigned counts the open tasks nobody has picked up.
The charts
Where the work sits counts the tasks in each board column, leaving out Done.
Tasks done per week counts the tasks completed in each of the last eight weeks.
Open tasks per person ranks up to eight people by open tasks, with you marked “you”. Only admins see this chart.
Projects lists each project you can see with its brands, its start and end dates (“open” when it has no end), its open tasks and the tasks done in the last 30 days. See Projects.
Who sees what
Two parts of these dashboards depend on your role rather than on your capabilities: Billed and collected on Commercial (your role must allow viewing revenue) and Open tasks per person on Delivery (admins). Everything else follows your capabilities and your brand access. See Roles and rights. Brands are explained in brands.