Business Intelligence overview
Business Intelligence groups your dashboards in one menu. See which of them appear, why the first is your home page, and how to reorder them.
Business Intelligence is the family of dashboards listed first in the left menu, unless you’ve moved it. Each dashboard sits on its own page and shows what the app already stores about your brands or your organization. You can use it as soon as Business Intelligence is switched on for your organization and for you.
The entries of the menu
In the left menu, Business Intelligence is a single entry with a sub-menu under it. Each entry of that sub-menu is a page with its own address, such as /dashboarding/watchers. Dashboards comes first: it lists every dashboard you can open and builds new ones from a sentence. Then come the five standard dashboards, then one entry for each dashboard you built.
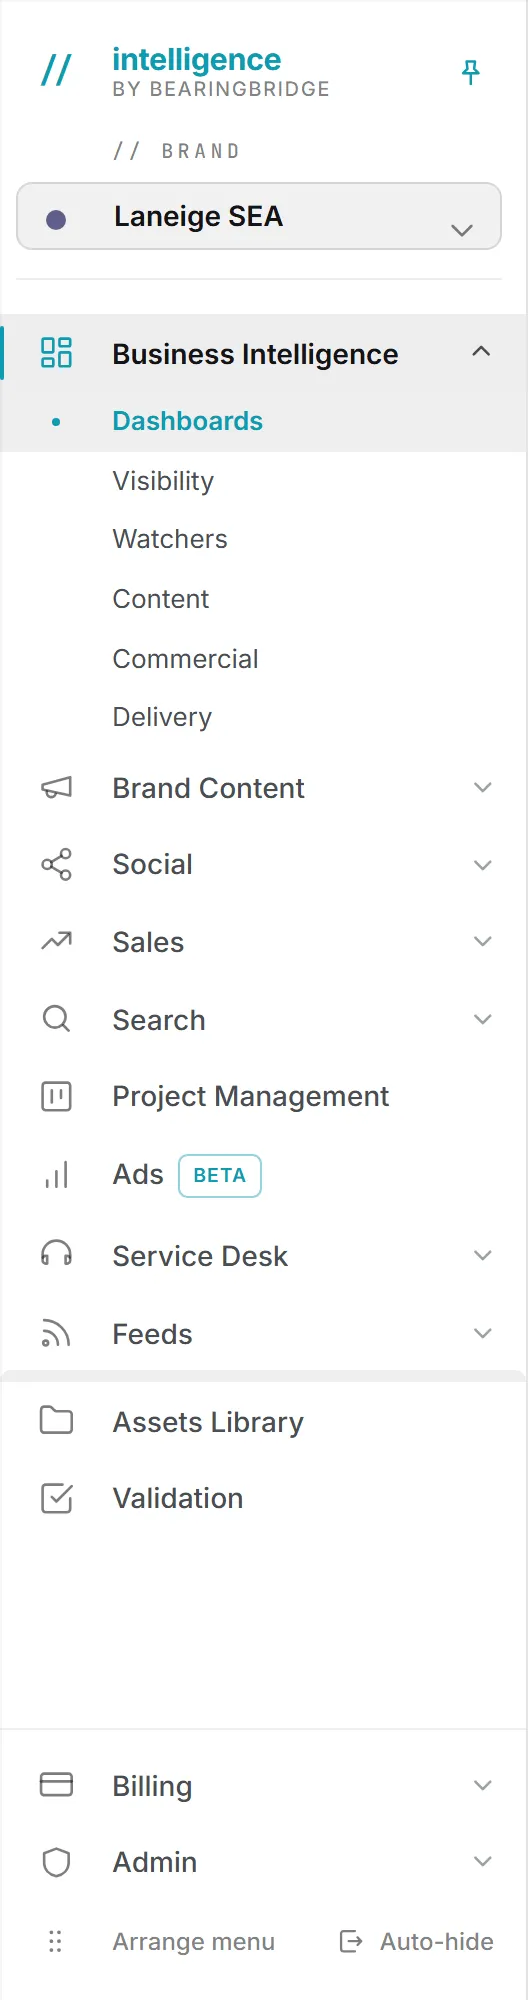
| Entry | What it shows | Capabilities needed |
|---|---|---|
| Dashboards | Every dashboard you can open, and the builder | Business Intelligence |
| Visibility | Google ranks and AI search results for the active brand | Business Intelligence and Search |
| Watchers | What the agents found across your brands, once agents run | Business Intelligence |
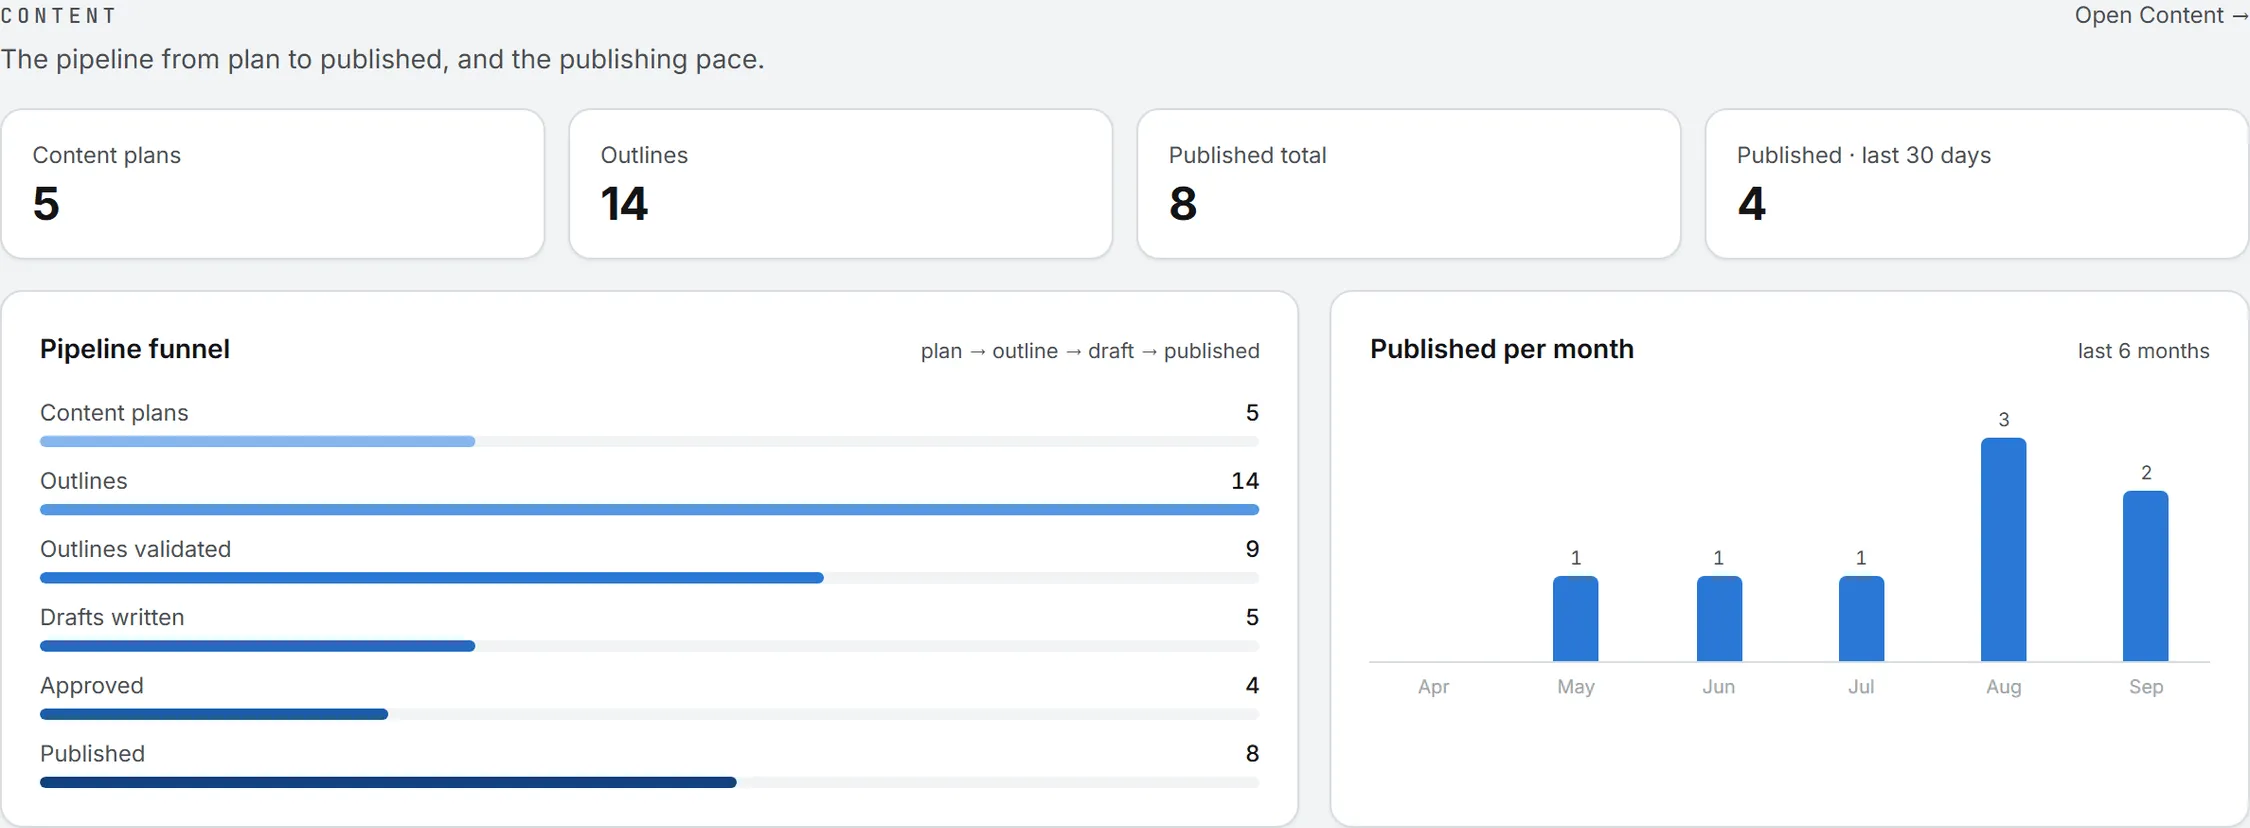
| Content | The content pipeline for the active brand | Business Intelligence and Brand Content |
| Commercial | The CRM pipeline and, if your role may see it, revenue | Business Intelligence and Sales |
| Delivery | The pulse of the task board | Business Intelligence and Project Management |
A capability counts only when it’s switched on for your organization and for you. A capability can be turned off at either level; see Capabilities and modules. A dashboard whose capability is off isn’t in the menu at all. Type its address anyway and you land on your first dashboard.
Note: Feeds used to be the first entry here. On September 20, 2026 it became a module of its own, with its own entry in the left menu and no capability to switch on. Its old address forwards to the new one.
The first entry is your home page
When you sign in, or open the app’s main address, it opens the first entry of this sub-menu. That’s your home page. Out of the box that is Dashboards. Move another dashboard to the top, one you built included, and that one becomes your home page. The order is yours: each person can pick a different home page.
Note: If Business Intelligence is off for you, the app opens Feeds instead, since that is the one module every account has.
Put the dashboards in your own order
- At the foot of the left menu, click Arrange menu. Small up and down arrows appear next to each entry.
- Open Business Intelligence and drag its entries into the order you want, or use the arrows.
- Click Done.
While you’re in that mode, you can reorder the main groups of the menu too. Your order is saved on your profile and follows you to any browser. Your colleagues keep their own.
To go back to the app order, click Arrange menu, then Reset to the default order.
Note: Reset to the default order resets every group of the menu, not only Business Intelligence.
Which dashboards follow the brand picker
Visibility and Content read one brand at a time, the one picked in the header. Pick another brand and the charts follow. If the active brand has Search or Brand Content switched off, the matching entry leaves the menu while that brand is active. See Brands.
Watchers, Commercial and Delivery read across the whole organization, limited to what you’re allowed to see.
Where the numbers come from
The numbers are worked out fresh each time you open a dashboard, from records the app already keeps: tracked keywords and their Google ranks, AI search runs, agent findings, content plans and articles, CRM deals, revenue lines and tasks. No chart imports or fetches anything new.
A chart with no data yet says which module fills it, so an empty dashboard usually means that module hasn’t been used for this brand yet. Hover any bar or point to see its exact value.
Days, weeks and months are counted in your own time zone and shown in your date format, as set in Settings.
The connected intelligence message
At the top of the dashboards, a message explains that the same dashboards can read your company’s own systems: a CRM, an ERP, a CMS, a PLM, or anything that exports data. It shows the connection already available (Zoho) and a Talk to us about connecting your data link. Only the BearingBridge team can switch this message off, and it goes for everyone at once.
Who can do this
| Action | Who |
|---|---|
| Open the dashboards | Everyone with Business Intelligence on, within their own data access |
| Reorder the sub-menu | Everyone, for their own menu |
| Build a dashboard | People whose role may create on Dashboards |
What it costs
Opening a standard dashboard is free, and so is every chart on it. It only reads data you already have and makes no AI or data call. A dashboard you built is different: each build and each refresh is billed like a question on Ask Intelligence. See Build your own dashboard. See credits and costs.